
A/B Testing Mistakes That Are Costing You Thousands in Lost Revenue
A/B testing mistakes can devastate your bottom line. One company experienced a 42% annual revenue drop after implementing changes based on flawed experiment data. These errors are more common than you might think. Research shows that 72% of the first 100 experiments contained mistakes that went unnoticed for eight months.
You need to understand what is an a/b testing and how to run a/b testing to improve your a b testing conversion rates. Common a/b testing pitfalls can turn winning strategies into pricey failures. Novelty effect a/b testing problems and statistical significance errors are just the start. This piece reveals the mistakes destroying your results. Setup errors, data quality problems, and post-test missteps waste your winning variations.
Critical setup mistakes before you start A/B testing
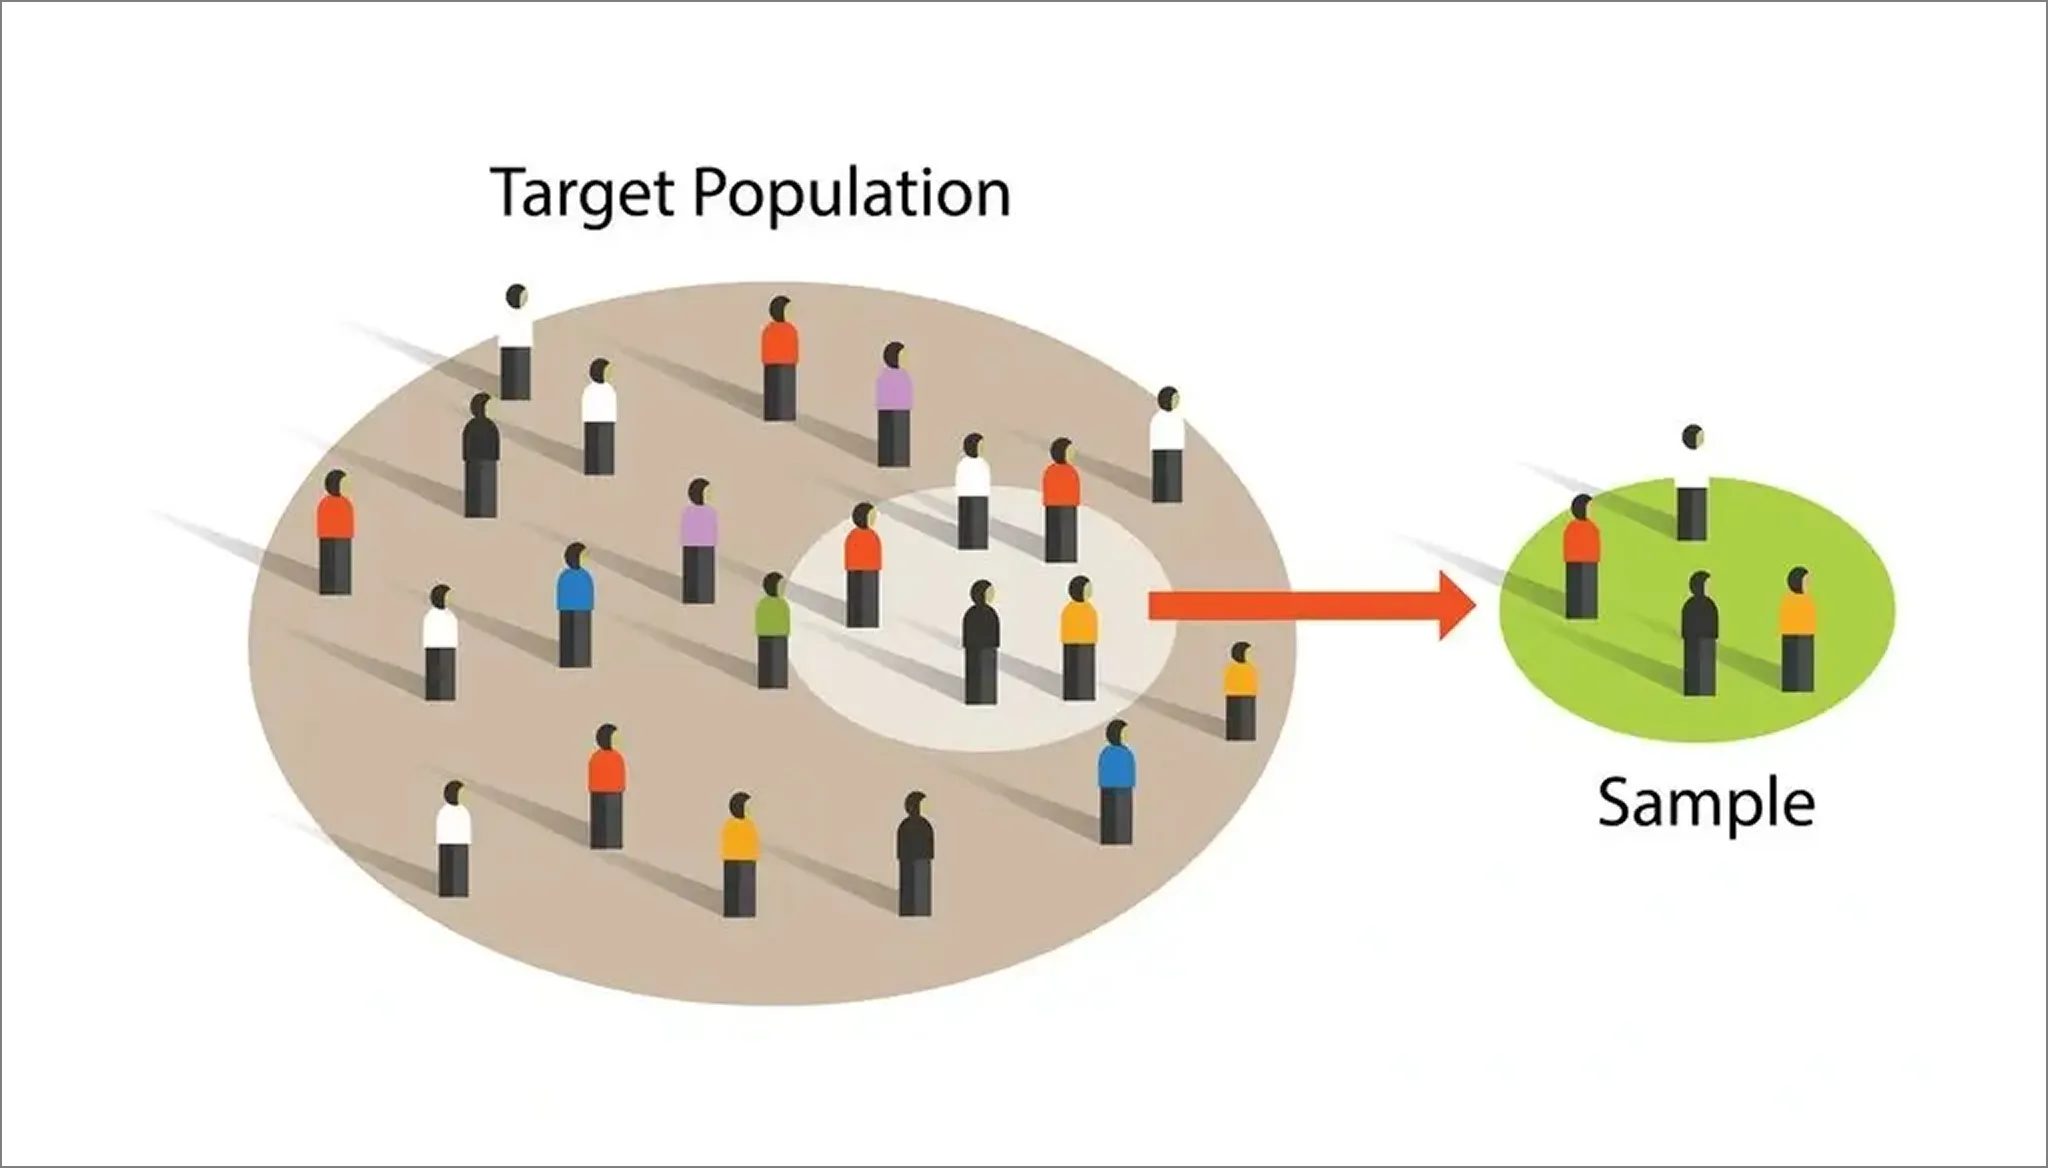
Image Source: GuessTheTest
Critical setup mistakes before you start A/B testing
The planning phase determines whether your experiment will generate applicable information or waste resources. Most A/B testing mistakes happen before you launch your first variant.
Testing without a clear hypothesis
Your test needs a specific, measurable hypothesis that states the change you’re making and the outcome you expect. A proper hypothesis follows this structure: “[changing this] will make [audience] [do this].” Vague statements doom your tests from the start.
Your hypothesis must connect to a clear conversion goal and problem statement. One in every seven A/B tests produces a winning result. This rate drops even lower when you test without informed hypotheses. Multiple variables change the nature of your test. Stick to single-variable experiments where you can measure specific metrics like click-through rates or conversion rates.
Not calculating required sample size upfront
You need to calculate your required sample size before launching. This prevents underpowered tests that produce unreliable results. Determine your baseline conversion rate, minimum detectable effect, and desired confidence level. Most tests use a 95% confidence level (alpha of 0.05) and 80% statistical power.
Take a 15% baseline conversion rate and an expected 18% rate after changes. You need around 1,892 sessions per variant. Tests with insufficient samples lead to inaccurate conclusions and wasted resources. Many teams monitor tests live and draw conclusions too soon, missing the appropriate sample size threshold.
Skipping audience segmentation
Tests on the “average visitor” produce misleading results. No such person exists. Each visitor segment responds based on demographics, behavior patterns and interests.
Pre-segmentation allows you to target specific groups experiencing particular problems. Checkout page changes tested on cart abandoners yield more applicable information than tests on all visitors. Segments that are too broad dilute test effectiveness. Segments that are too narrow lack sufficient data.
Running tests on low-impact pages
Pages with low traffic can’t generate enough data points for statistical significance. You need thousands of users interacting with your variants to reach meaningful conclusions. Tests on low-traffic pages make A/B testing an ineffective approach. Focus your testing efforts on high-impact pages where you can accumulate sufficient visits to reach appropriate confidence levels.
Common errors during the A/B testing process
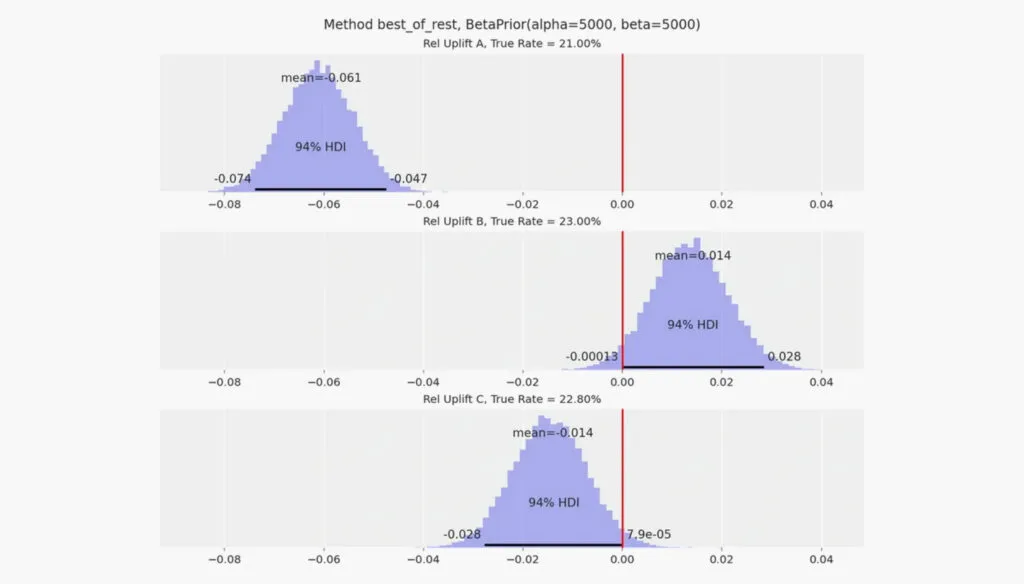
Image Source: PyMC
Execution mistakes turn promising experiments into unreliable data sources. The problems you encounter during active testing often invalidate results faster than setup errors.
Testing too many elements at once
More variations divide your traffic and extend test duration. Multiple variations cause false positive rates to climb. Testing 41 variations at a 95% confidence level produces an 88% chance of false positives, while testing just two variations keeps this risk at 5%. Each additional variation requires more traffic to reach valid conclusions. Cookie deletion becomes a major issue when tests run beyond 3-4 weeks and introduces sample pollution that corrupts your data.
Ending tests before reaching statistical significance
A 95% statistical significance represents the minimum threshold for reliable results. But significance alone doesn’t determine when to stop. You must also reach your calculated sample size before ending any experiment. The recommended minimum duration is 2 weeks, though you should run tests through at least one complete business cycle. Stopping early based on promising interim results creates statistical bias that you can’t calculate or correct.
Ignoring the novelty effect in your results
Novelty effect causes temporary metric spikes that fade after the original exposure period. Your existing audience reacts differently to new experiences because they’re unfamiliar. This effect can make interventions appear 2% to 27% better during the novelty window. Run tests for at least 4 weeks to account for this temporary inflation when major changes affect user flow.
Changing test parameters mid-experiment
Traffic allocation, test goals, or variation designs modified during active tests invalidate your results through Simpson’s Paradox. Traffic split changes only affect new users and create disproportionate returning visitor ratios that skew conversion data.
Using tools that slow down your site speed
Testing platforms add latency through network requests and JavaScript execution. Slower pages reduce conversions and create a paradox where your optimization tool hurts the metrics you’re trying to improve. Server-side or edge computing implementations eliminate client-side performance costs.
Post-test mistakes that waste your winning results

Image Source: Stackmatix
Winning tests lose their value when you fail to capture and apply insights the right way. Poor post-test handling transforms verified improvements into missed opportunities.
Not documenting test results and learnings
Your test data represents company property purchased with time and money. Knowledge disappears when team members leave without structured documentation. Document each test’s rationale, hypothesis, design, results, decisions and lessons learned for future reference. Store documentation in shared, searchable locations that new team members can access during onboarding. Past test records help you avoid repeating experiments and identify patterns in user behavior across your site. This knowledge base accelerates hypothesis creation and reveals opportunities to duplicate past wins.
Implementing changes without monitoring downstream effects
A variation that improves one metric can damage another. Set up guardrail metrics to track potential adverse effects across different revenue paths. Changes create ripple effects as you move downstream through your funnel. Signals weaken as visitors from different paths meet. Start your experience to become skilled at strategic pricing through our Profit Pulse Audit and find hidden profit potential in your current pricing structure.
Applying winning variations to wrong audience segments
Post-test segmentation introduces two critical problems. Segment sample sizes often fall below statistical validity thresholds even when overall tests reach significance. That’s the first issue. The second is that examining multiple segments increases false positive likelihood. At 95% confidence, expect one false positive for every 20 segments analyzed. Simpson’s Paradox strikes when sampling isn’t uniform across segments and can reverse conclusions. Verify segment findings through separate follow-up tests before implementation.
Data quality issues destroying your A/B testing conversion rates
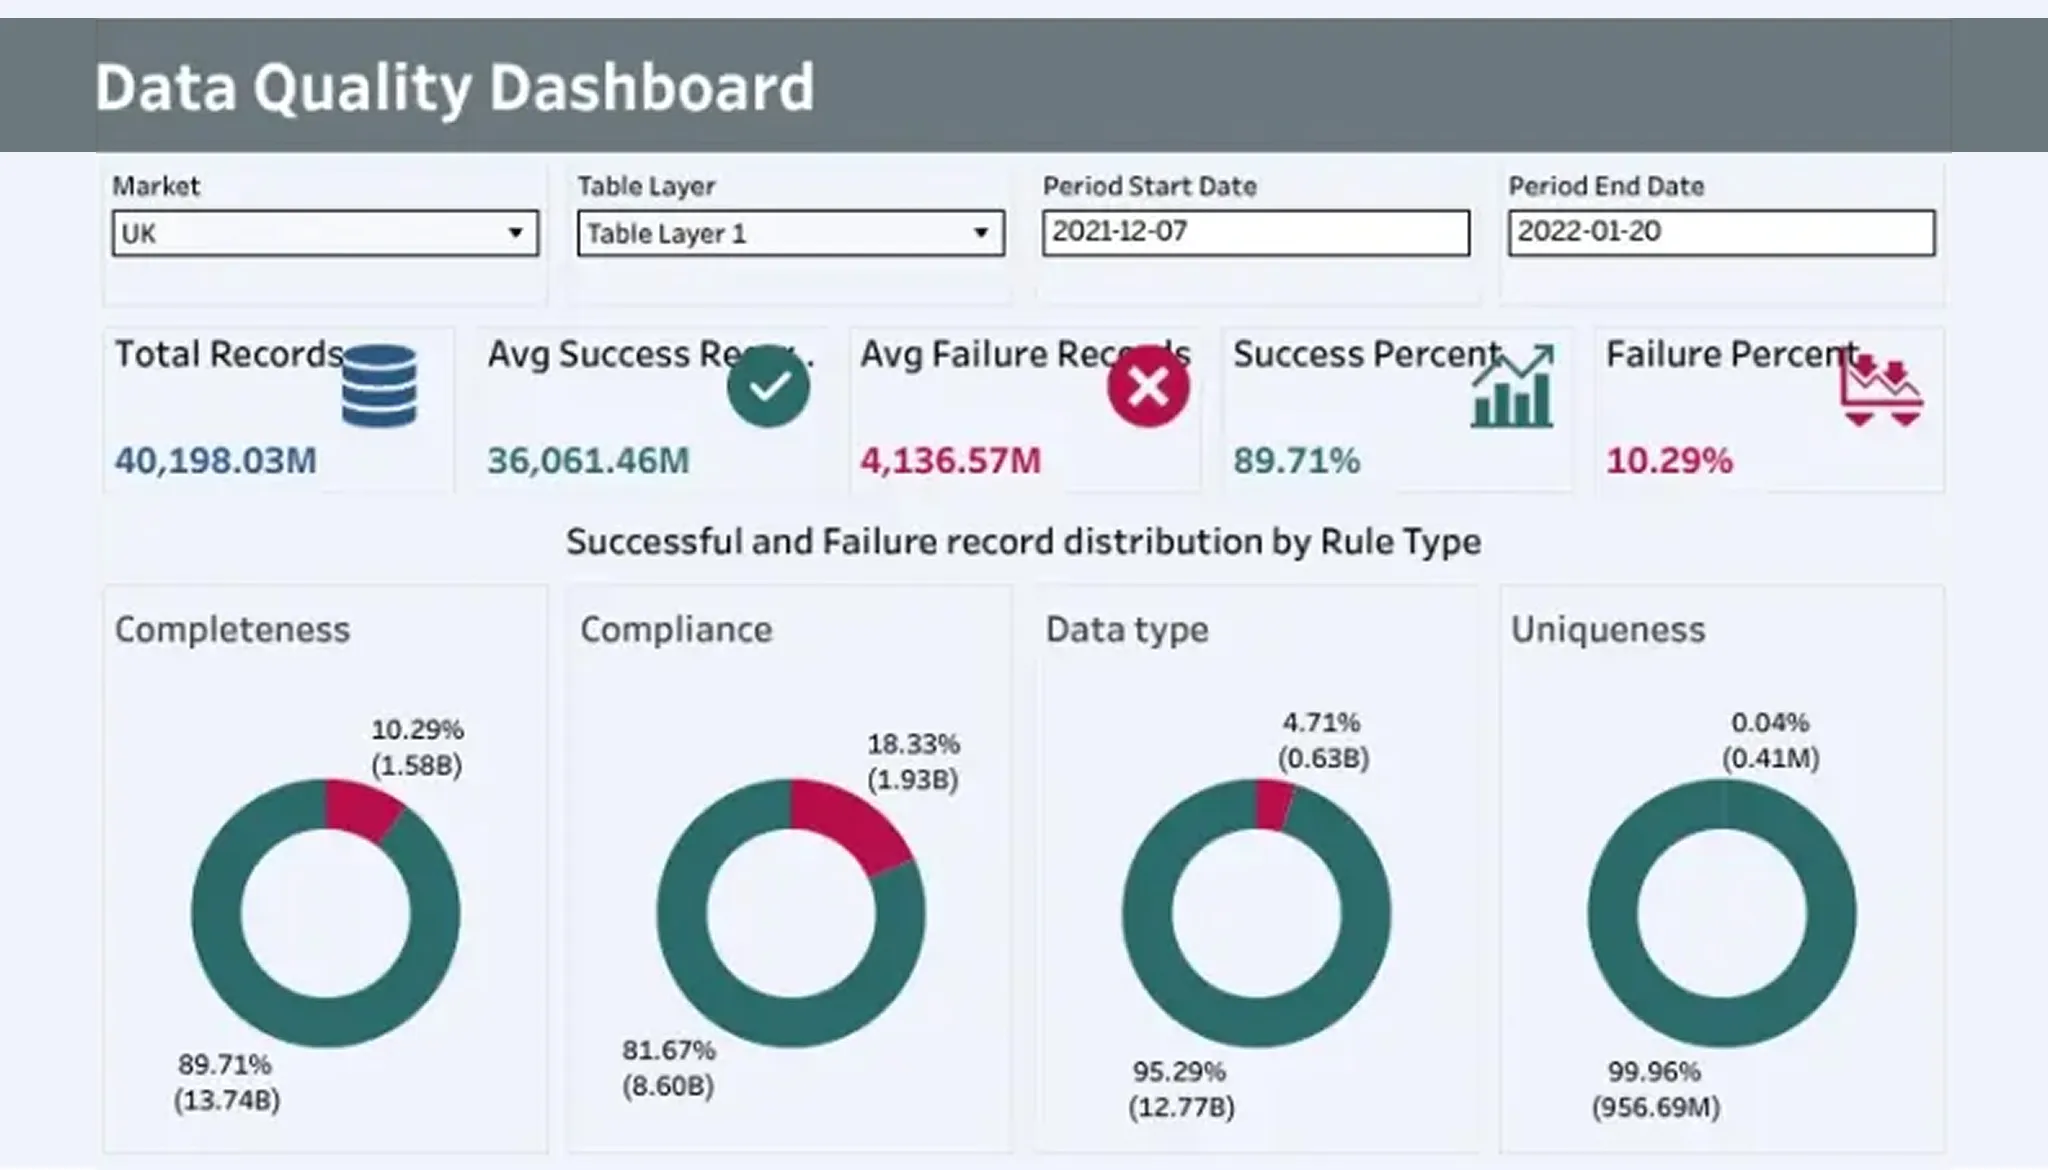
Image Source: Tableau Public
Data quality problems destroying your A/B testing conversion rates
Bad data changes winning tests into losing implementations. Data quality problems create measurement errors that compound across your testing program.
Running tests with inaccurate tracking setup
Tracking accuracy determines how reliable your results are. Conversion tracking mismatches between platforms average 37.5%, with 5-15% called normal. Anything beyond this threshold needs immediate investigation. Your tracking chain has browser tags, GTM, server-side events, analytics platforms and CRM systems. Each layer introduces possible failure points. Test conversions must fire exactly once per action and contain correct transaction IDs with complete campaign parameters. Validation needs checking that the same conversion appears consistently across ad platforms, analytics tools and business outcome systems.
Not cleaning outliers from your data
Outliers inflate variance and reduce statistical power. This makes tests less likely to detect actual effects. Revenue metrics show skewed distributions where extreme values distort conclusions. Winsorization caps extreme values at predefined percentiles while preserving dataset integrity. The approach replaces the top 1% with the 99th percentile value. This retains outliers but minimizes their variance impact.
Failing to check for sample ratio mismatch
Sample ratio mismatch happens when traffic distribution between variations becomes severely unbalanced. Research shows approximately 6% of A/B tests suffer from SRM. Detection needs statistical testing beyond visual inspection, as ratios lack sample size context. Experiments with SRM show twice as many statistically significant metrics and lead to faulty conclusions.
Ignoring validity threats in your results
Validity threats increase error likelihood in your experiments. History effects happen when external variables skew results during testing. Selection bias occurs when samples don’t represent your entire audience. Testing tools cannot account for all validity threats automatically. Concurrent campaigns, technical upgrades and seasonal factors present risks that invalidate conclusions.
Conclusion
These points show that avoiding A/B testing mistakes protects your revenue and revolutionizes your optimization program from guesswork into a reliable growth engine. Each error compounds over time and turns potential wins into failures that get pricey. Proper methodology beats fast results every time. Begin your trip to become skilled at pricing through our Profit Pulse Audit and find hidden profit potential in your current pricing structure. Apply what you’ve learned here and test methodically. Your conversion rates will climb.