
The Hidden Math Behind Willingness to Pay Analysis: What Data Really Shows
AI shows remarkable accuracy when it determines how much consumers will pay for products. Businesses are reshaping their pricing approach with AI-powered tools. This shift became clear when over 3 million ChatGPT-based applications appeared just two months after OpenAI launched its online store. Every business faces a basic pricing challenge - customers leave when prices are too high, and profits disappear when prices are too low.
Predicting customer buying behavior needs complex statistical models. Modern AI micro-segmentation groups customers by their expected payment levels using many data points about their traits and actions. This creates more accurate targeting than we’ve seen before. Businesses can now set prices based on what customers value. The maximum price customers will pay for a product, service, or feature defines their Willingness-to-Pay (WTP). This powerful capability brings major responsibilities. Companies need to balance quick revenue gains with their brand’s trust and customer loyalty. You can turn pricing into a strategic advantage that boosts your bottom line through willingness to pay conjoint analysis and complete cost benefit reviews.
The Statistical Foundations of Willingness to Pay Analysis
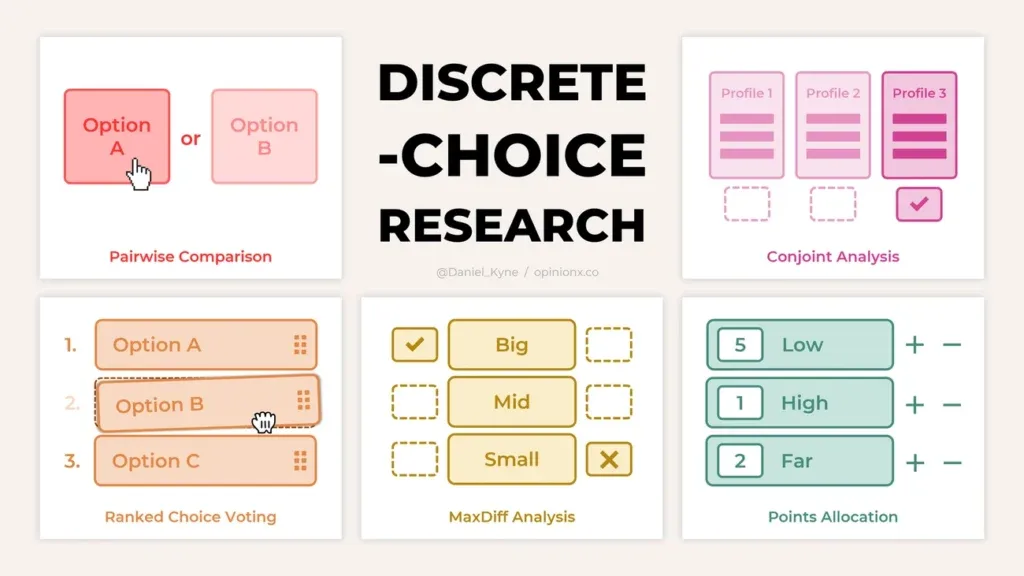
Image Source: OpinionX
A strong statistical framework powers every successful willingness to pay analysis. This framework helps turn raw consumer data into practical pricing insights. You can spot meaningful patterns in what seems like random consumer choices by learning about these statistics.
Discrete Choice Models in WTP Estimation
Modern willingness to pay analysis relies on discrete choice experiments as its life-blood. These models show how likely consumers are to pick one option over another based on utility differences. The consumer choice can be expressed as:
ProbabilityofchoosingA = f(β₀ + β₁Feedifference + β₂Accountproviderdifference + β₃Privacydifference)
The estimated coefficients show how sensitive consumers are to different features. This allows calculation of willingness to pay as the ratio of two marginal utility coefficients. To name just one example, if β₂ shows preference for a provider and β₁ shows price sensitivity, willingness to pay equals β₂/β₁ multiplied by the price difference. This method gives not just single numbers but confidence intervals through techniques like the delta method - a must-have for reliable pricing decisions.
Conjoint Analysis vs. Contingent Valuation Methods
Both conjoint analysis and contingent valuation offer better approaches than simple surveys to find willingness to pay. Each has its own features:
-
Contingent Valuation (CV): Asks consumers directly what they would pay for specific features or products
-
Conjoint Analysis (CJ): Shows multiple product versions with different features and analyzes how choices reveal preferences
Research shows these methods often produce very different results. Conjoint analysis typically shows willingness to pay estimates four to five times larger than contingent valuation figures. This difference happens in part because conjoint analysis counts “maybe” answers as yes, which can push estimates higher.
Latent Class Models for Consumer Segmentation
Latent class models boost willingness to pay analysis by finding distinct consumer groups with similar preferences. These models build on simple frameworks by connecting variables like age and household income with core preference measures. This grouping shows how willingness to pay changes across different consumer segments. Companies need this information to create pricing strategies that encourage engagement to maximize both adoption and profit.
These statistical foundations help turn willingness to pay cost benefit analysis from theory into real pricing strategy. You’ll feel more confident setting value-based prices that capture more of your created value.
How Visual and Contextual Cues Influence WTP
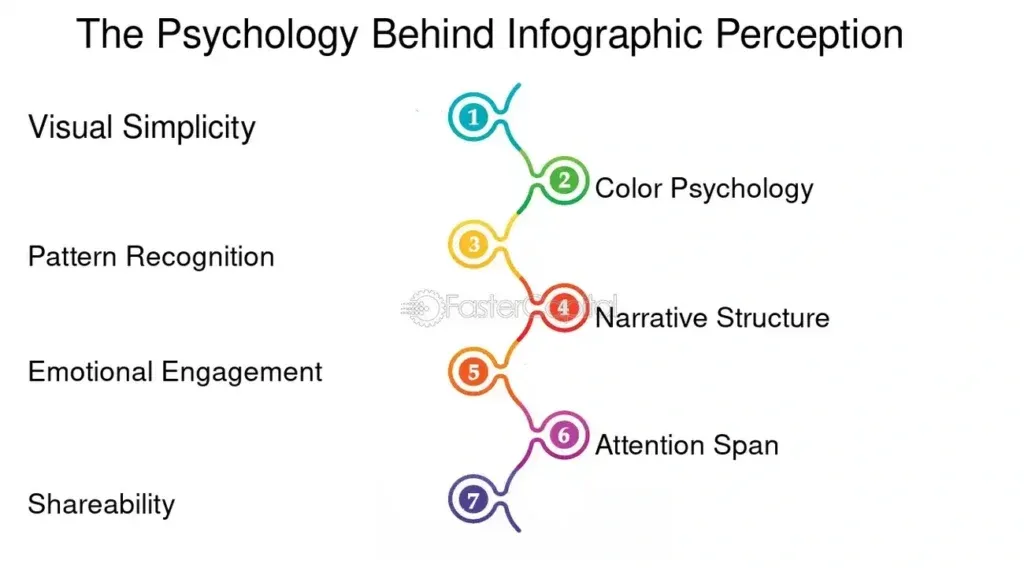
Image Source: FasterCapital
Visual and contextual elements are powerful drivers that shape how much consumers will pay. These elements often work behind the scenes, below our conscious awareness. Your pricing strategy can improve by understanding these subtle psychological triggers.
Machine-like vs. Handwritten Typeface Effects
Typeface choice shapes how consumers see products and make purchase decisions. This visual cue creates immediate first impressions of a product. Products with high-end typefaces make people willing to pay more compared to those using low-end fonts. The match between typeface and context matters too. Machine-like typefaces work better in non-conversational contexts. Handwritten typefaces boost results in conversational settings.
Conversational vs. Non-conversational Question Framing
Question framing in pricing surveys changes how customers respond about their willingness to pay. Studies reveal that response behavior shifts based on how questions are worded. Simple phrases like “prices in general” instead of “inflation rate” lead to higher expected values. People also show more uncertainty with simpler wording. Personal stories that share emotions and experiences are more convincing. These stories boost purchasing decisions. This works even better with handwritten typefaces. People feel a genuine human connection and see the message as more sincere.
Perceived Authority and Friendliness as Mediators
Visual cues affect willingness to pay through specific psychological channels. Machine-like typefaces in non-conversational contexts create authority, which makes people willing to pay more. Handwritten typefaces in conversational settings create friendliness, which also increases willingness to pay. These insights show that willingness to pay analysis must consider these emotional triggers. Different typefaces and conversation styles spark distinct emotional responses. These responses directly affect how much value consumers see in your offerings.
Experimental Design in WTP Research

Image Source: Examples.com
Accurate analysis of how much customers will pay depends on solid experimental methods. Your choice of experimental design will affect how reliable and valid your pricing insights are.
Study Design: Between-Subjects vs. Within-Subjects
The way you expose participants to single or multiple treatments shapes your experimental results. Between-subjects designs let each participant experience just one condition. This gives more conservative results and reduces the chance of bias. On the flip side, within-subjects designs expose participants to multiple treatments. This approach needs 50% fewer subjects to get the same amount of data points, making it more affordable. In spite of that, within-subjects methods might create order effects. You can alleviate these effects through counterbalancing - half the participants see condition A then B, while others see B then A.
Cross-Cultural Sampling: US, Ghana, and China
Research in different markets shows how culture affects what people will pay. A newer study, published by researchers who used six experiments with 3,634 participants from the United States, Ghana, and China, breaks down how typeface-question matching affects willingness to pay for AI products. Testing across multiple countries helps us learn about how different cultures see pricing.
Moderating Role of AI Knowledge in WTP Perception
People’s familiarity with AI technologies changes how much they’re willing to pay. One study used a between-subjects design with 297 participants to learn about how AI anxiety affected willingness to pay through perceived value. Another study with 506 participants used a 2×2 between-subjects design to break down how self-efficacy changes this relationship. These findings show how psychological factors create big differences in what different customer groups will pay.
Interpreting the Data: What WTP Really Reveals
WTP analysis goes beyond basic pricing data and gives us deep insights into how consumers think and how markets work.
WTP as a Proxy for Perceived Value
A welfarist view shows that WTP acts as a proxy for people’s priorities and utilities. Research supports WTP as the best available way to measure outcomes, but its true value lies in the information it contains. Your choice of method shapes this information—individual WTP measures benefits for specific people, while average WTP combines data across populations. Yes, it is worth noting that when we look at consumer WTP for innovations, research reveals that what others might pay has a stronger effect on overall WTP than individual amounts. You can learn how these insights apply to your market through our free Profit Pulse Audit.
Limitations of Self-Reported WTP
Records show that all but one of these self-reported expenses (46%) don’t match actual spending. This happens due to memory errors, unclear priorities, and hypothetical bias. The expenses that people most likely have records for are reported with less accuracy. Studies in controlled environments show that the mean difference between hypothetical and real WTP ranges from 0.28 to 0.32.
Implications for Willingness to Pay Cost Benefit Analysis
Money must measure all benefits and costs in cost-benefit analyzes, which makes WTP interpretation vital. Simply adding individual feature premiums creates WTP estimates that can mislead. Companies that ignore competitive options often end up with inflated WTP figures. A proper understanding shows that WTP isn’t fixed—strategic positioning can shape it.
Conclusion
Your pricing strategy changes from guesswork to a competitive edge based on real data when you analyze customers’ willingness to pay. Statistical models like discrete choice experiments and conjoint analysis create frameworks that show meaningful pricing insights from how consumers behave. These models also reveal how small details—typefaces, question framing, and your authority—affect what customers will pay for your products and services.
The way you design your experiments makes a big difference in this analysis. Choosing between between-subjects or within-subjects approaches affects both your statistical power and keeps costs down. When you sample across cultures, you’ll see that willingness to pay varies by market. You need specific pricing strategies for each market instead of using one approach for all.
Knowing what willingness to pay really shows gives you a powerful edge over competitors. Self-reported WTP might not match actual spending behavior, but the data still teaches you a lot about how customers value your offering. You should approach cost-benefit analyzes carefully because WTP changes based on your strategic position in the market.
Modern AI-powered pricing tools help you target different customer groups with amazing precision based on what they’ll pay. Smart implementation of these tools leads to real profit growth. You have an important choice to make—use these advanced analysis techniques to get more value from your offerings or watch your competitors do it instead. Start your journey to master strategic pricing through our Profit Pulse Audit and find hidden profit potential in your current pricing structure.